Thu 18 August 2022
This article is a follow-up to the previous article on how to write an OXO Agent. In the following sections we will share tips and tricks to make the task of writing & debugging agents a simple task.
OXO’s engine & Agents logs
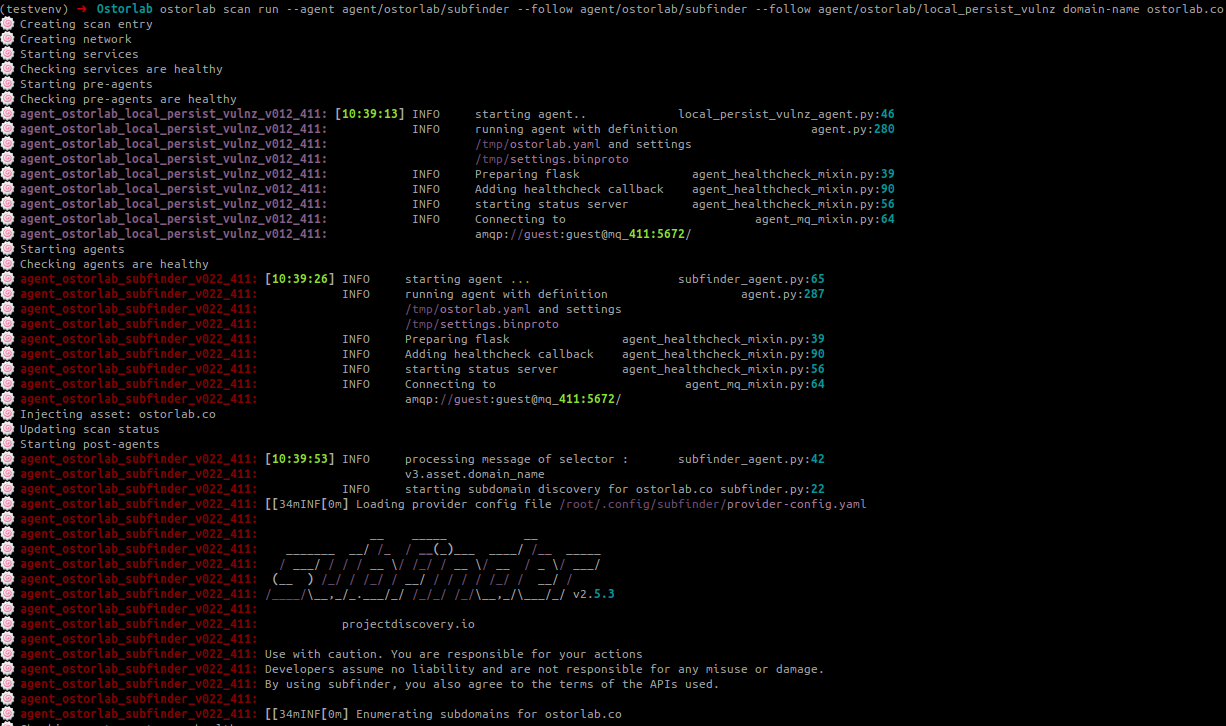
OXO’s engine accepts a --debug flag, that will set all loggers, OXO’s, and any third-party package to debug level. This will display a lot of information about what is happening, some of which are very useful, for example, you can answer questions like was the network created successfully, are the agent’s configurations the right ones, are system agents healthy, etc.
Suppose you are only interested in investigating a specific agent or a set of agents. In that case, you can use the --follow agent/<organisation>/<agent_name> flag to only display logging messages for a specific agent.
You can follow as many as you want; each will be color coded differently for easier readability.
Here are both flags in action:
oxo --debug scan run --agent agent/ostorlab/subfinder --follow agent/ostorlab/subfinder --agent agent/ostorlab/dnsx --follow agent/ostorlab/dnsx domain-name ostorlab.co
You are basically debugging docker containers
Since the agents are docker services working collectively to scan an asset, one can make use of docker commands to help investigate:
docker service ls: Lists running services. Useful to see which agents are up and which are down.
docker service logs <service>: Displays log messages of the agent docker service.
docker service inspect <service>: Displays metadata of the service’s state, configurations, etc.
docker stats <container>: Displays information about the state of the container like CPU%, memory & IO usage.
Remember that you can always get a shell inside the agent with:
docker exec -it <container> bash/sh, for more control over how you want to drive your investigation.
In some cases, you won’t have a clear error message, but you know something is wrong, maybe the message is not emitted or processed, maybe it was emitted, but to the wrong queue, maybe you added a unicity check to not process the same message twice, but it is still getting processed again and again, or it could be a completely different reason.
RabbitMQ
The agents use RabbitMQ as a message broker, to send and receive messages. One thing we can do is to get a shell into the RabbitMQ container and use the RabbitMQ cli commands to:
Get the list of queues with columns specified, you can add and remove them depending on your need:
rabbitmqadmin list queues name node messages messages_ready messages_unacknowledged message_stats.publish_details.rate message_stats.deliver_get_details.rate message_stats.publish

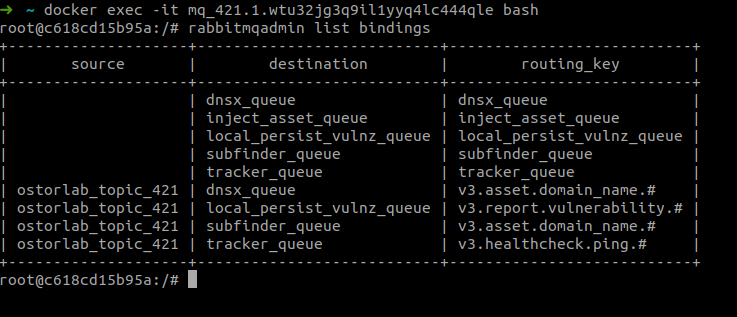
Display the list of bindings: bindings are rules for routing messages to respective queues:
rabbitmqadmin list bindings
Test queues to respond within the timeout. Lists those who did not respond:
rabbitmqctl list_unresponsive_queues
Another approach you can take when it comes it the RabbitMQ service is to use the --mq-exposed-ports flag and specify the port of the RabbitMQ management user interface to be exposed, for example :
oxo scan --mq-exposed-ports 15672:15672 run --agent ...
Then you can access the interface with 127.0.0.1:15672 with 'guest' as the default username and password.
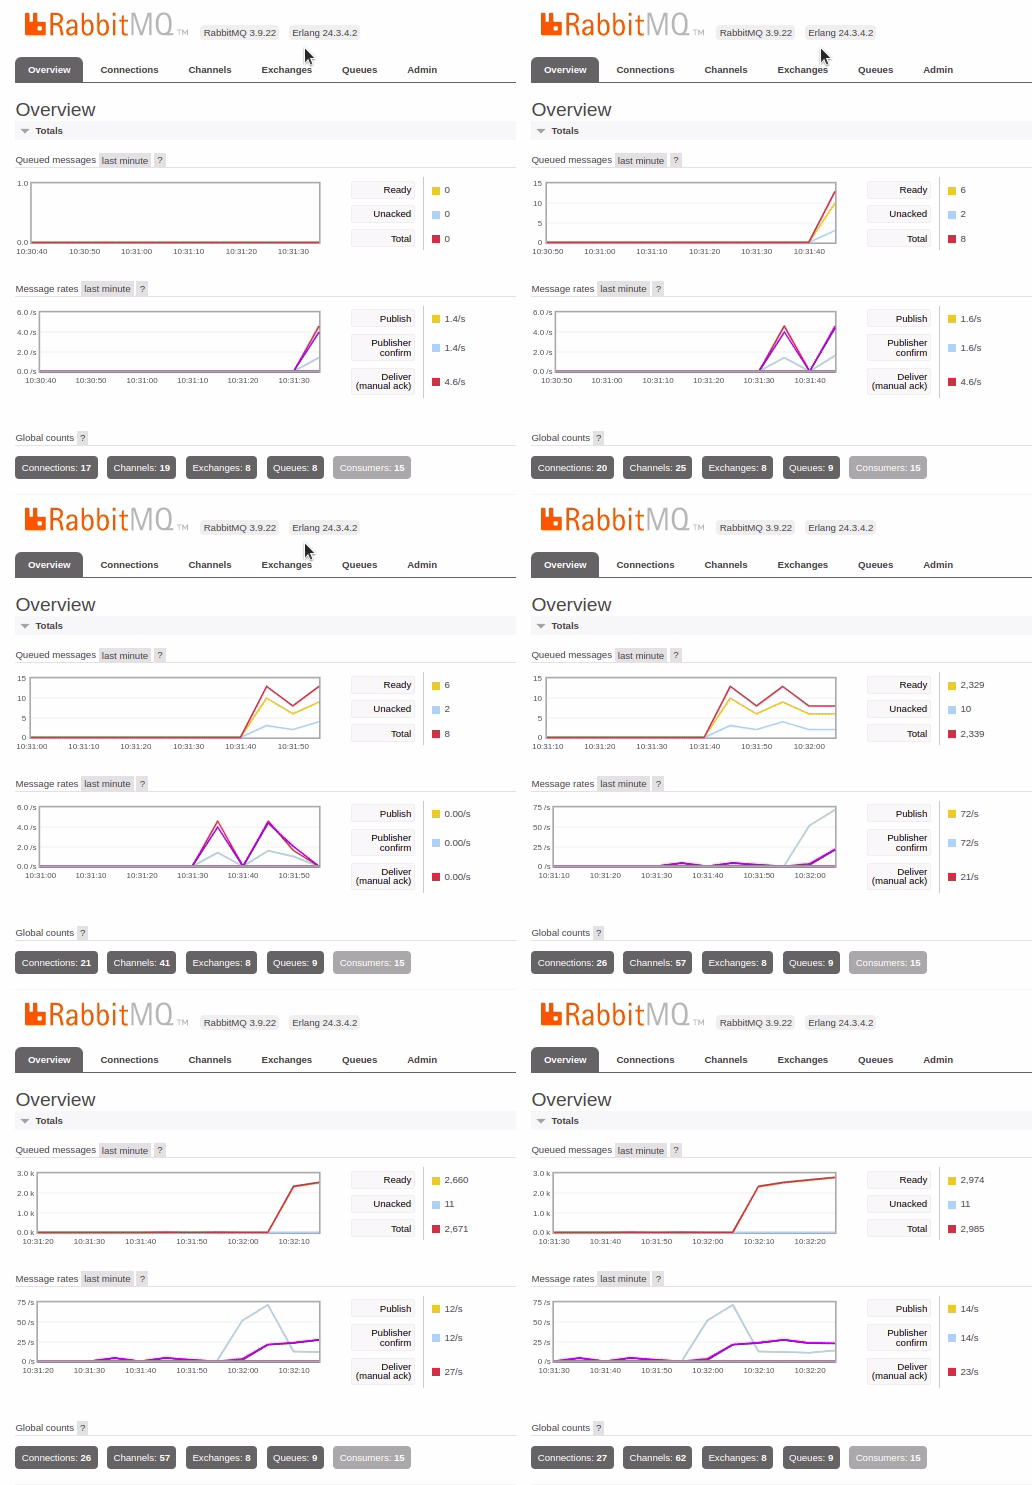
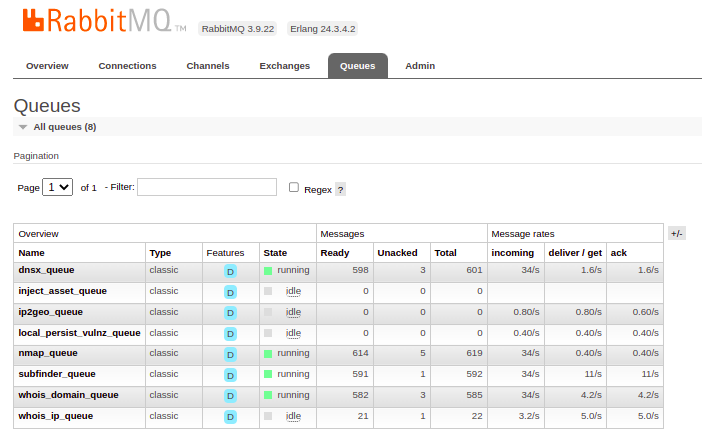
You can achieve the same as the command line we saw in the previous section like listing queues, exchanges, the number, and rate of delivered or processed messages or just get an overall idea about the state of the service.
Redis
Redis does not expose a management user interface, however since it is intuitive, we do not really need that. With basic commands we can answer questions like:
What keys are persisted?
KEYS <regex>
you can use * to show all the keys or any regular expression to limit the output.
Does a key exist?
For strings, bytes and sets use:
EXISTS <key>
For hashmaps use:
HEXISTS key fields
What’s the value type of a specific key?
TYPE <key>
What's the value of a specific key? Depending on the type: For string/bytes values
GET <key>
For hash-maps values
HGET <key> <field>
Or to list all the values
HGETALL <key>
For all values of a set
SMEMBERS <key>
Tracing
Distributed tracing is a way to get a bird's view into how a request is flowing from one system to another. It can help us troubleshoot messages as they move from one agent to another.
OXO comes with instrumentation already implemented for both process & emit messages methods. In other terms you can see when a message was processed, with which selector, the content of its data, and also the value of its output or emitted results
To enable the tracing of messages between agents, we can run the classic oxo scan run command with the --tracing flag.
This will expose jaeger; a user interface for monitoring and tracing transactions between distributed services. In simple terms, it serves the purpose of visualizing the chain of events happening between microservices, in our case between Agents.
You can follow a message being processed by Agent1, then the results of the processing emitted to Agent2 and so on. You can see different attributes like time, duration, which selector was used, the value of the message..etc.
Before explaining the results, let’s talk briefly about the main concepts of OpenTelemetry.
1. Trace: The path taken by requests, in our case the messages, as they propagate between multi-service architectures, in our case between agents.
2. Span: A tracked operation performed by or to the request. In our case, for example, the message being processed.
3. Context: Metadata that helps track spans when they move between the services. It is basically the traceID and spanID that help us link the flow of the message between the agent.
So by running :
oxo scan --tracing run --agent agent/ostorlab/subfinder --agent agent/ostorlab/dnsx domain-name ostorlab.co
Subfinder and DNSx agents will be launched on ostorlab.co and a browser will open at: http://127.0.0.1:16686 with the jaeger user interface.
The other agents get spawned after the jaeger service, so it is normal to not see anything at first.
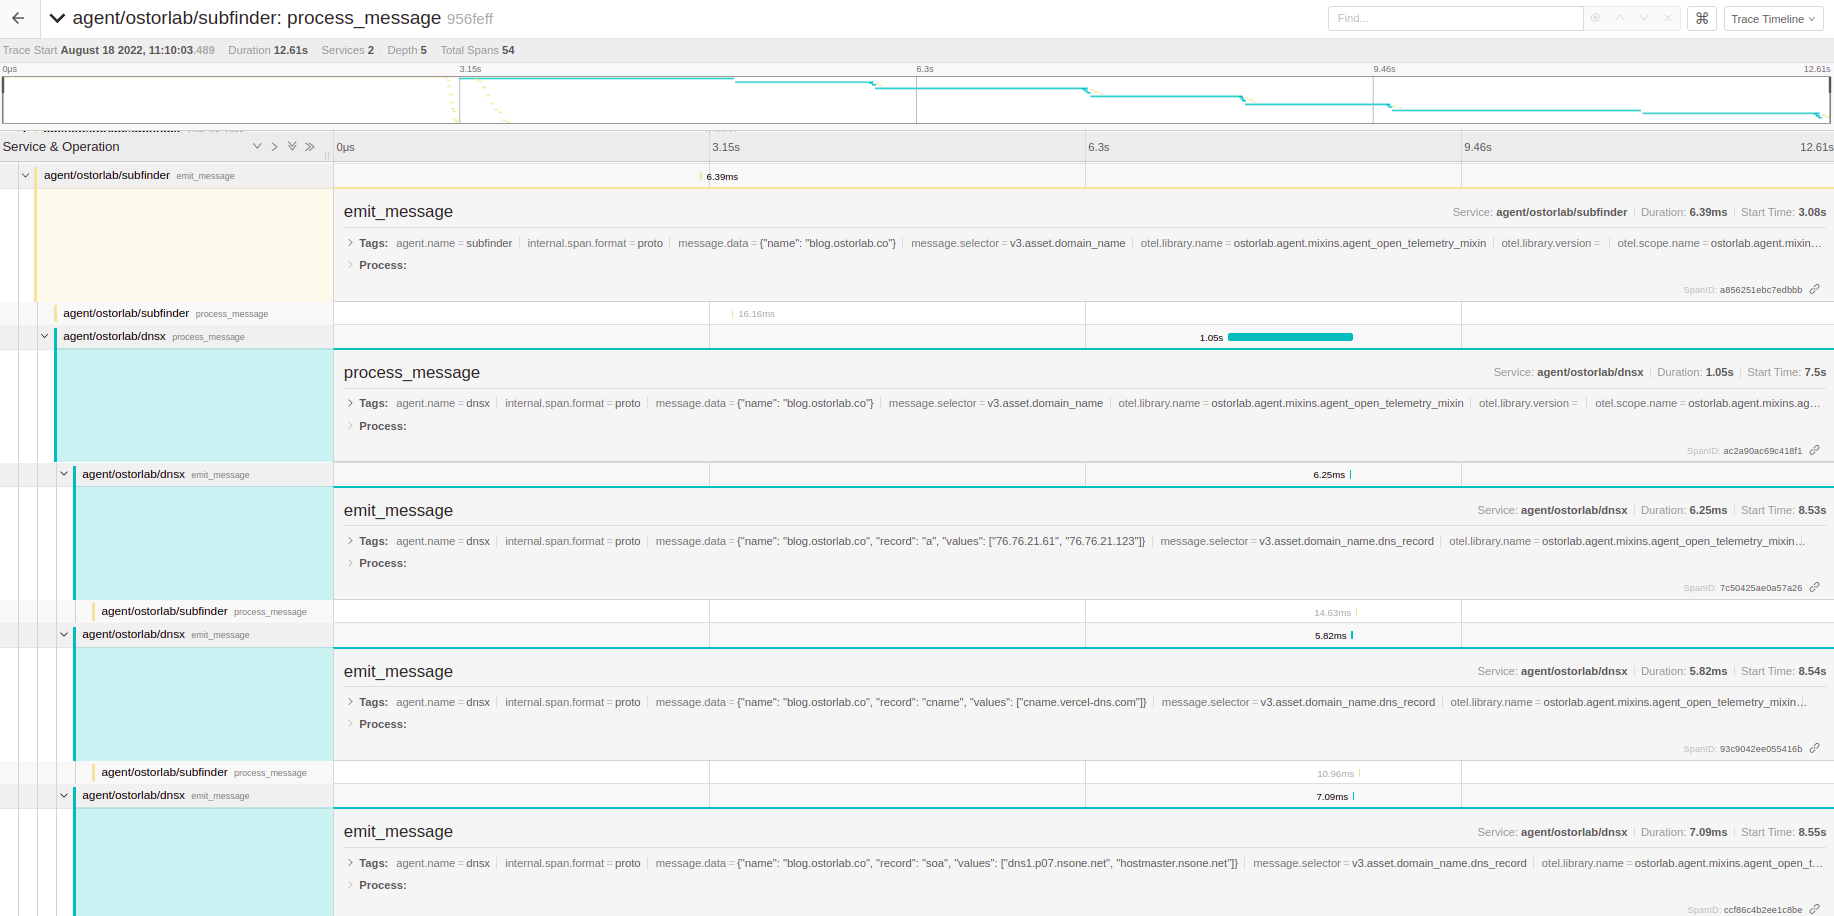
We can see the 2 agents in the services dropdown, if we take the example of the Subfinder agent:
We see our first domain message ostorlab.co as the root span, and its children underneath, describing the path of what happened.
The first message was processed, and 10 other messages were emitted, each with a specific subdomain: docs.ostorlab.co, blog.ostorlab.co.

Each of those were picked up by the DNSx agent, processed and each emitted DNS records with extra information.
Unit tests
At the beginning of the agent development cycle, it is preferred to make use of the power of unit tests to make sure your code is actually working and achieving its purpose. It is an efficient way to eliminate bugs or weird behaviors coming directly from the agent code and not from external sources or from the interaction of your agent with the rest of the system.
OXO offers pytest fixtures to help cover the whole process in unit tests, for example:
agent_run_mock: This fixture patches the agent low-level methods like the agent service health check, initializing the RabbitMQ server, connecting to it, consuming and emitting messages. It also returns an AgentRunInstance instance with the following attributes:
agent_run_mock.raw_messages: List
agent_run_mock.emitted_messages: List
So a check like:
assert len(agent_run_mock.emitted_messages) > 0
tells us that there was some emitted message. We can access the first element for example with:
agent_run_mock.emitted_messages[0]
which is a Message class with the following attributes:
message.selector
message.data
These attributes can help us verify that we have used the correct selector for example or that the message data is what we expected.
agent_persist_mock: This fixture patches the Agent Redis persistence component and returns a dictionary mimicking Redis, with the keys as Redis keys, and the values respecting the types stored in Redis. This is useful, for example to test agents that inherit from the persist_mixin to implement a unicity check for the received messages, to not process the exact message multiple times, or when you need a counter that can be used by all replicas of an agents.
assert agent_persist_mock.get('<key>') is not None
assert agent_persist_mock.get('<global_counter>') == 42
Conclusion
We have seen different aspects of how to debug agents. From using basic commands to display logs, check the RabbitMQ queues, and verify Redis data exist. We have also seen how to follow message traces through their life cycle and how we can make use of the offered pytest fixtures to test our code even before spawning the agent.