Nuxt.js debugging in Webstorm
How to debug Nuxt.js application on Webstorm
To debug a Nuxt.js application using webstorm:
- Configure
devtoolto useeval-source-map. Devtool is a webpack setting that controls source code mapping:
  build: {
    /*
     ** You can extend webpack config here
     */
    extend(config, ctx) {
      // config.devtool = 'eval-source-map'
      if (ctx.isDev && ctx.isClient) {
        config.devtool = 'eval-source-map'
      }
    }
  }
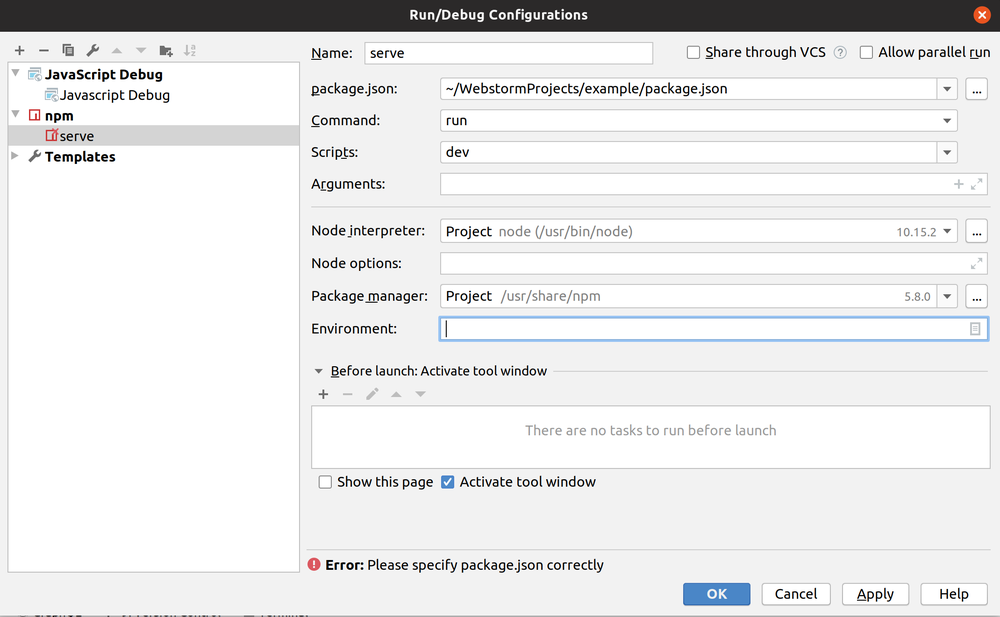
- (Optional) Serve your application by adding an npm target to Webstorm:
- Add a target to debug your Javascript point to your application URL:

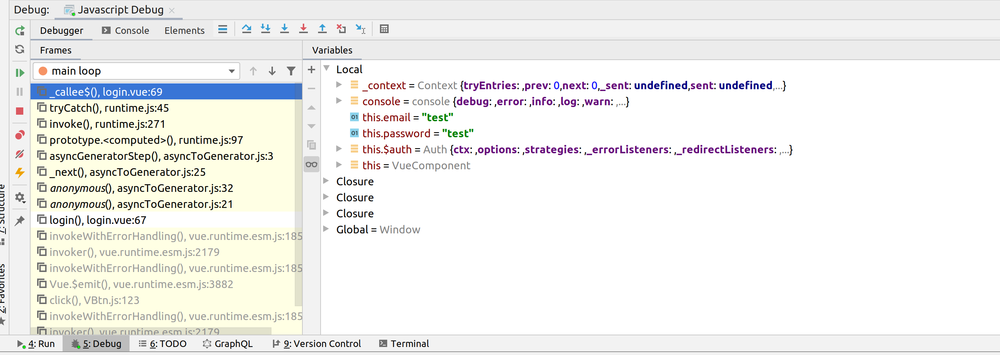
- Set your breakpoint and start debugging.
Tags:
debug