Thu 20 October 2022
One of Ostorlab's main focuses this year has been tackling the issues of Inventory management and attack surface detection and addressing the variety of challenges around it. Be it asset ownership, detection of unknown or rogue assets, or keeping a historical record of asset evolution to know what changed and when.
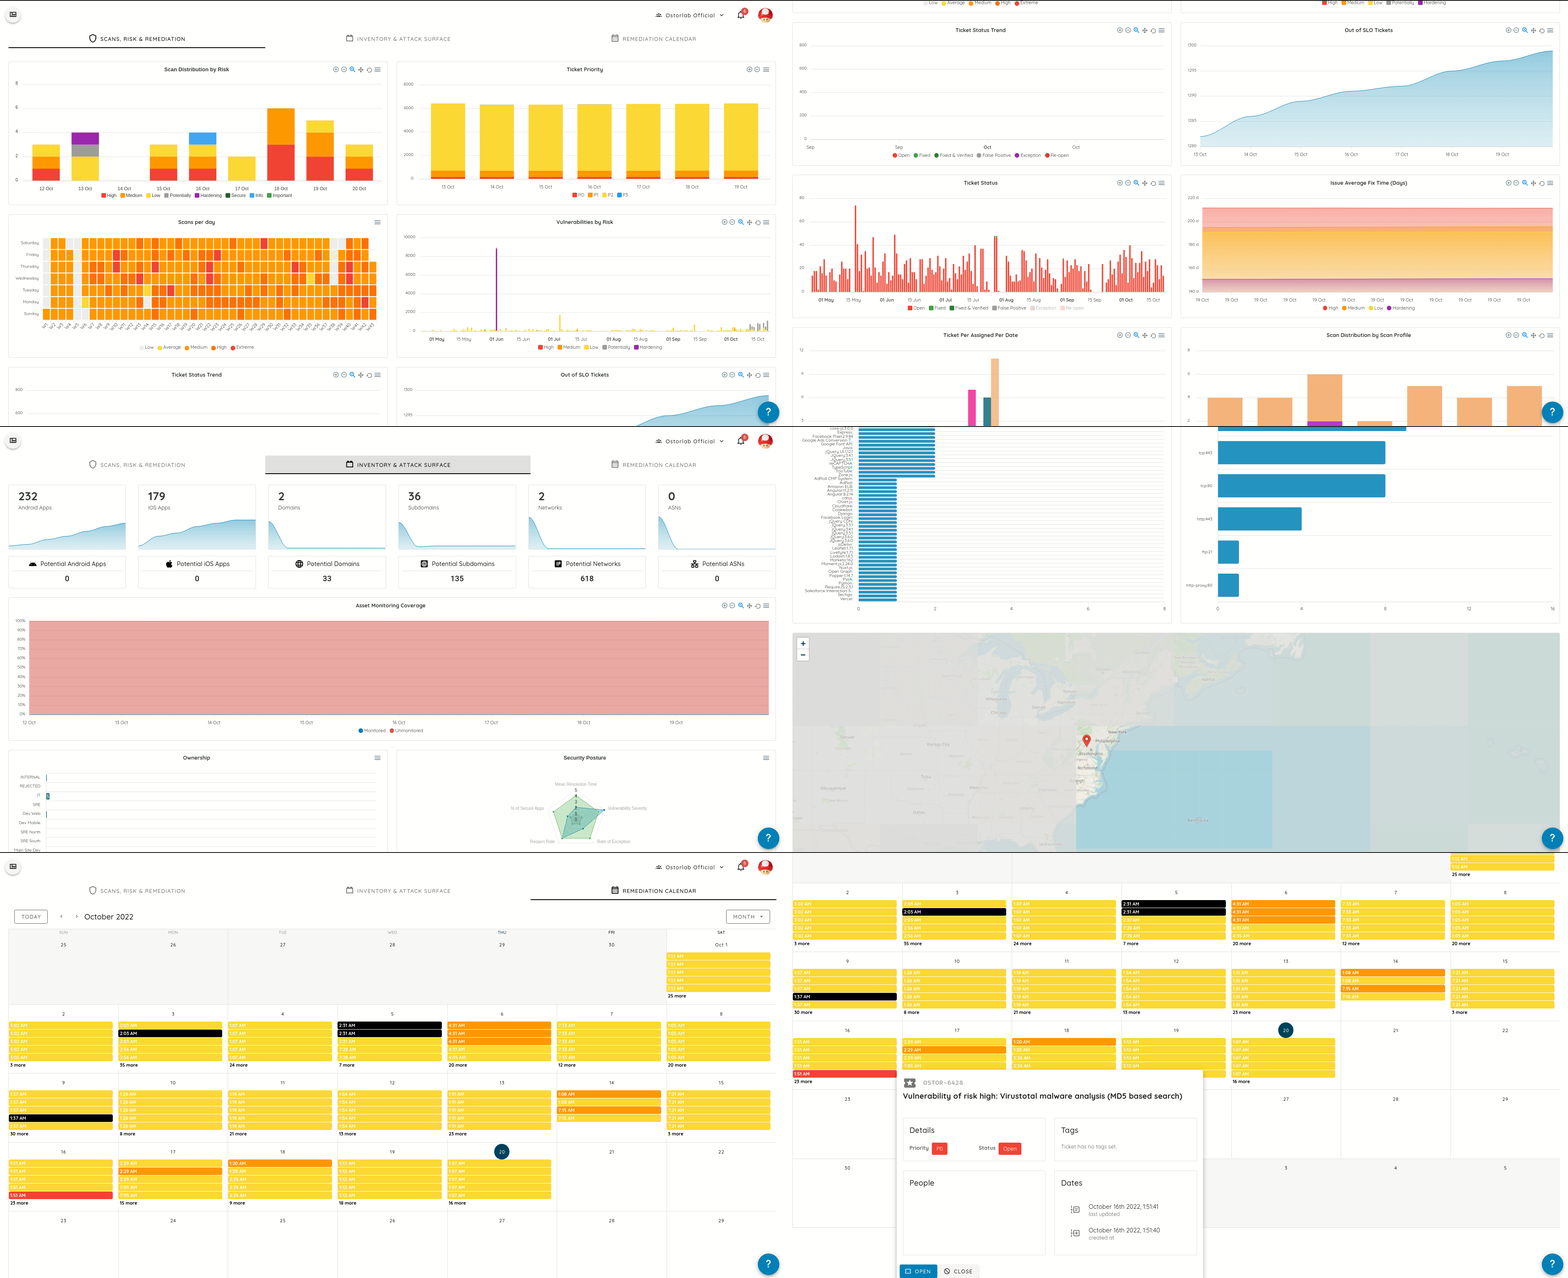
As a reflection of the many new capabilities and changes we have made,we have released a new dashboard providing better insights into an organization's security posture.
The new dashboard allows you to answer questions like:
- What is the size of my infrastructure?
- How many potential assets are detected that require my attention?
- What is my monitoring coverage?
- What is the distribution of my assets by owner?
- What is the distribution of my assets by logical location?
- How do I compare against other organizations?
- What are my most common tech stacks and most common exposed services?
- Where are my assets located geographically?
- What are my most vulnerable assets?
- What are the most common vulnerability classes I am seeing?
- How far am I lagging behind in vulnerability fixes?
- How often do I stick with a scan schedule?
- Who is fixing most issues in my team / organization?
The new dashboard is a powerful way to present data about your risk, inventory, and remediation efforts. It has been redesigned to showcase data in a quick, easy-to-grasp format with the most relevant information understandable at a glance.
The dashboard is categorized into three sections namely "Inventory & Attack Surface", "Scan, Risk, and Remediation", and finally a "Remediation Calendar".
All metrics have been logically grouped to make it easy to evaluate your organization's posture.
Old dashboard
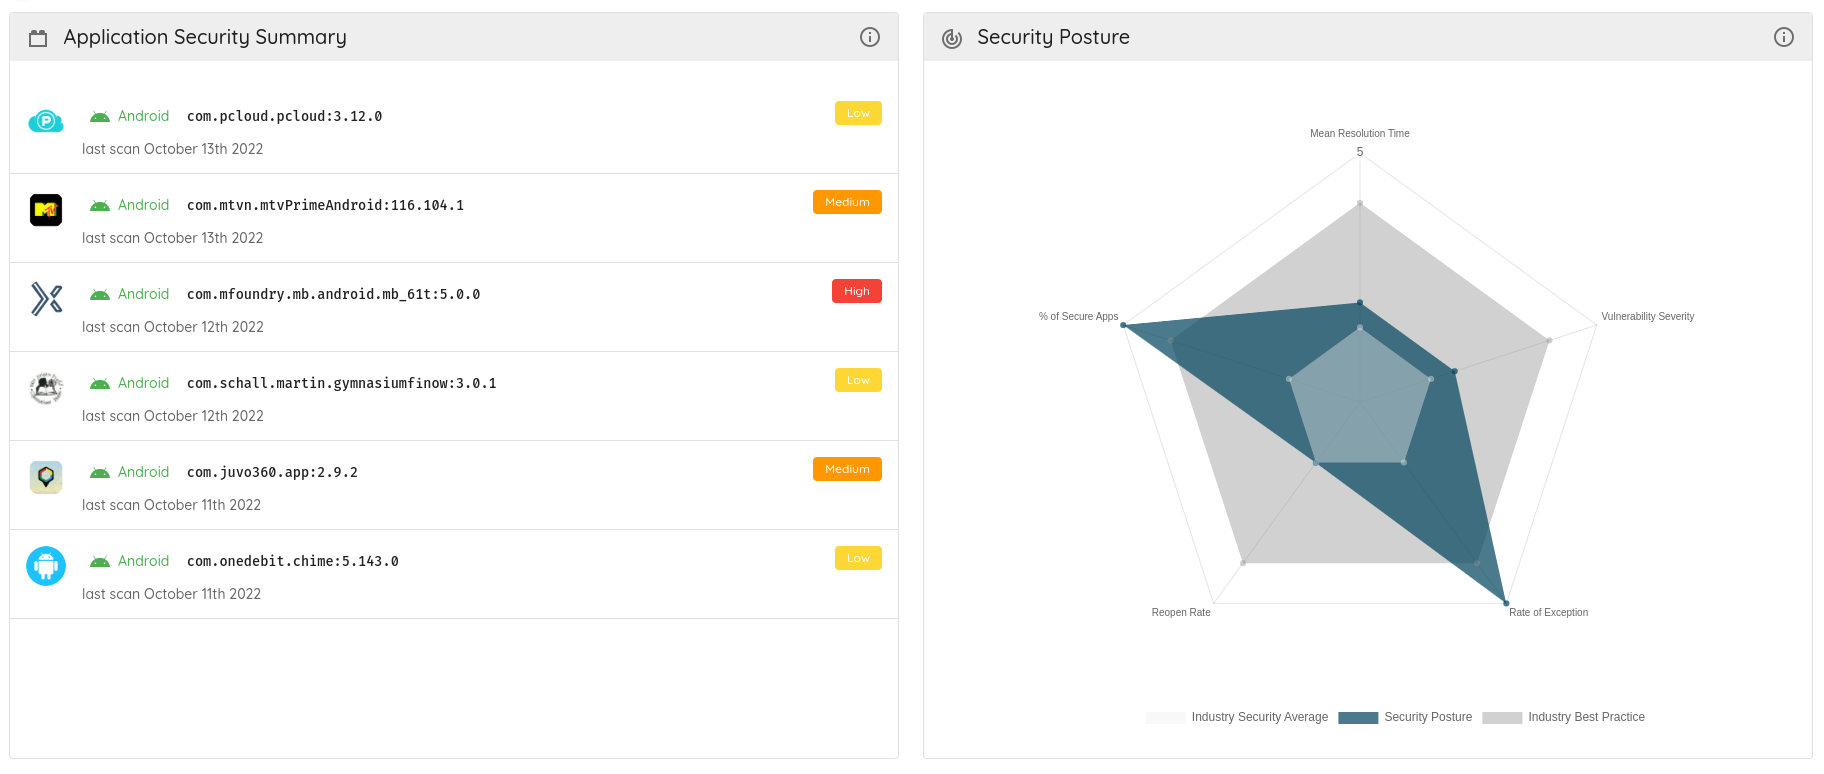
New dashboard
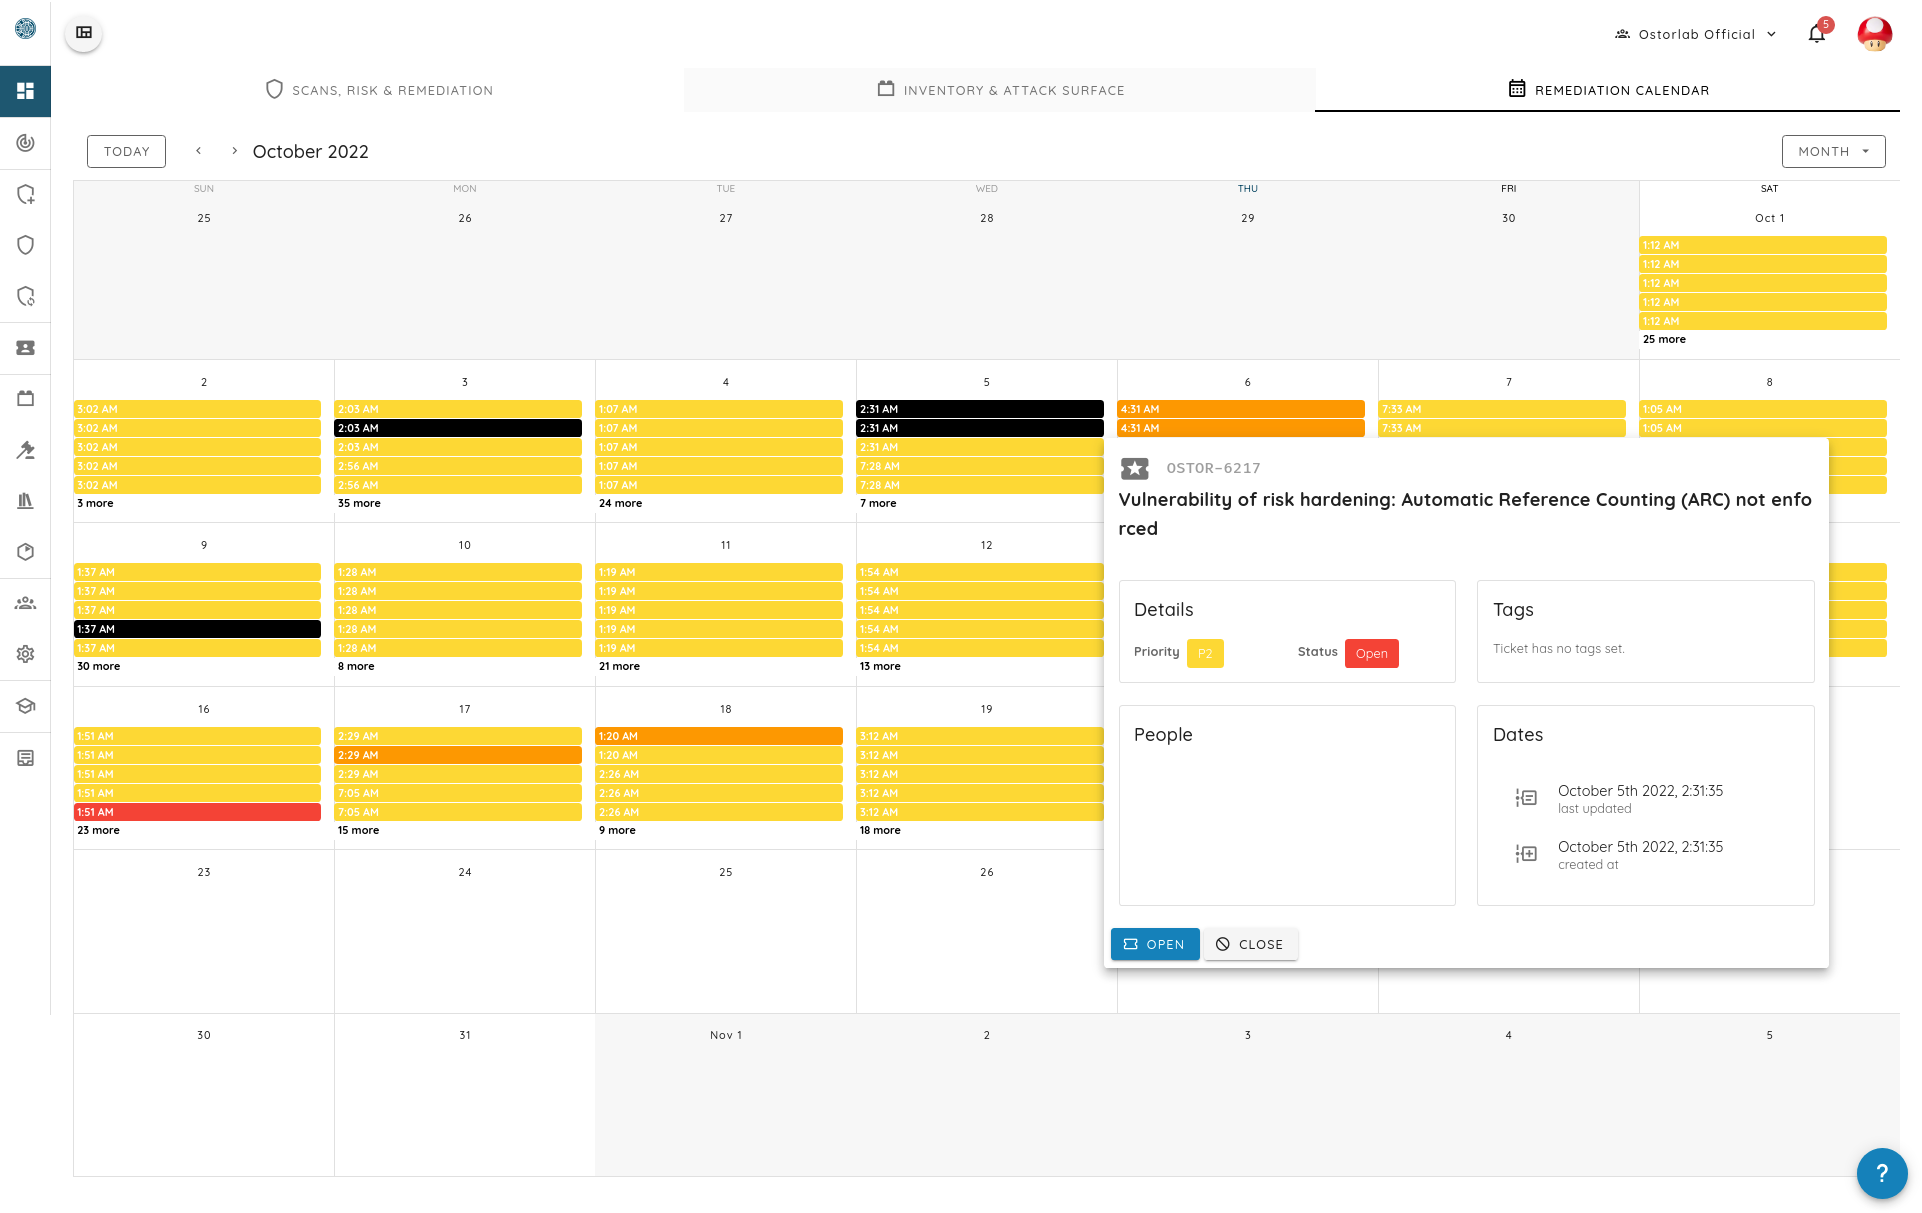
Inventory & Attack Surface
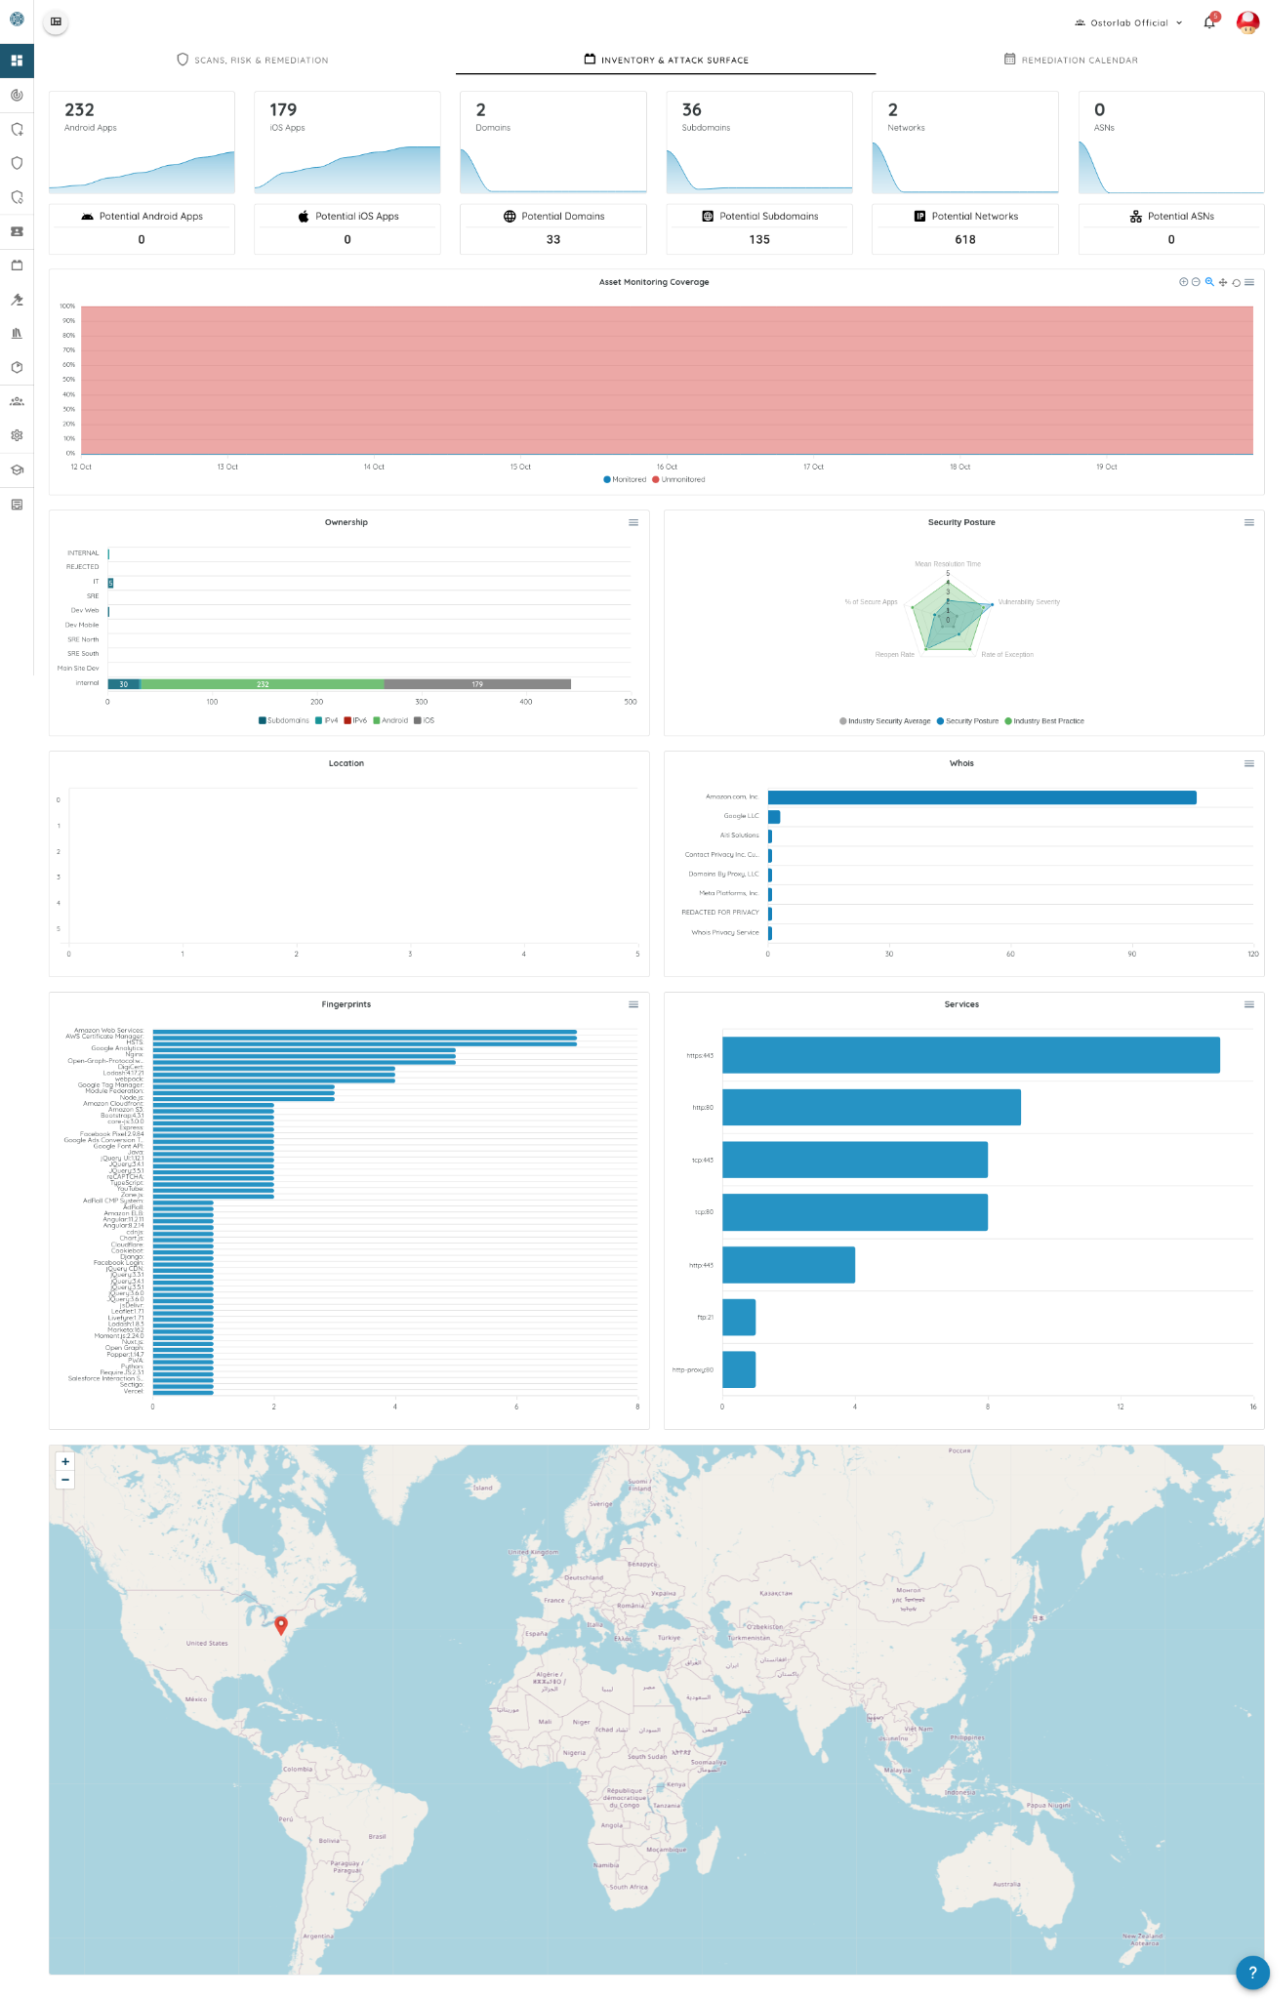
The inventory section of the dashboard features all metrics related to assets belonging to or potentially belonging to your organization.
Asset Trends
These metrics tell you the number of assets (per type) of your organization and the count of potential assets per type. The asset trends are a useful way to see the evolution of the number of assets of your organization over time. It also makes the count of potential assets easily accessible in case there is something important you are missing from your inventory.

Asset Monitoring
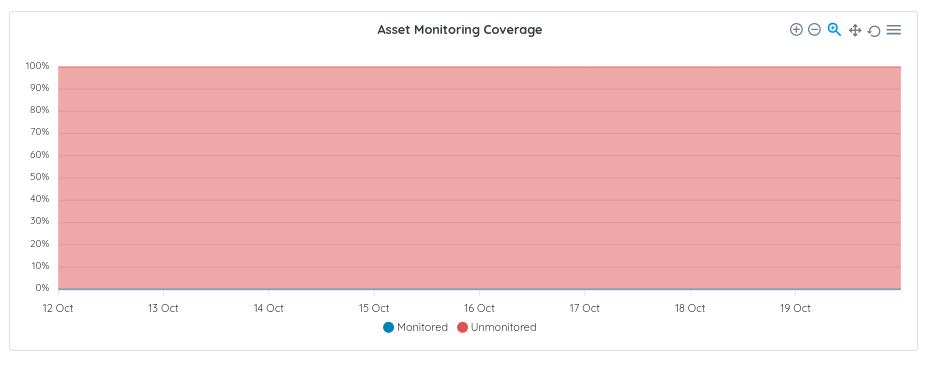
Asset monitoring shows the ratio of the monitored assets. Ostorlab supports continuous and time-based monitoring with the ability to detect new releases and trigger a new scan automatically.
These metrics show how many are covered and how many are still done manually.
Fingerprint and Services
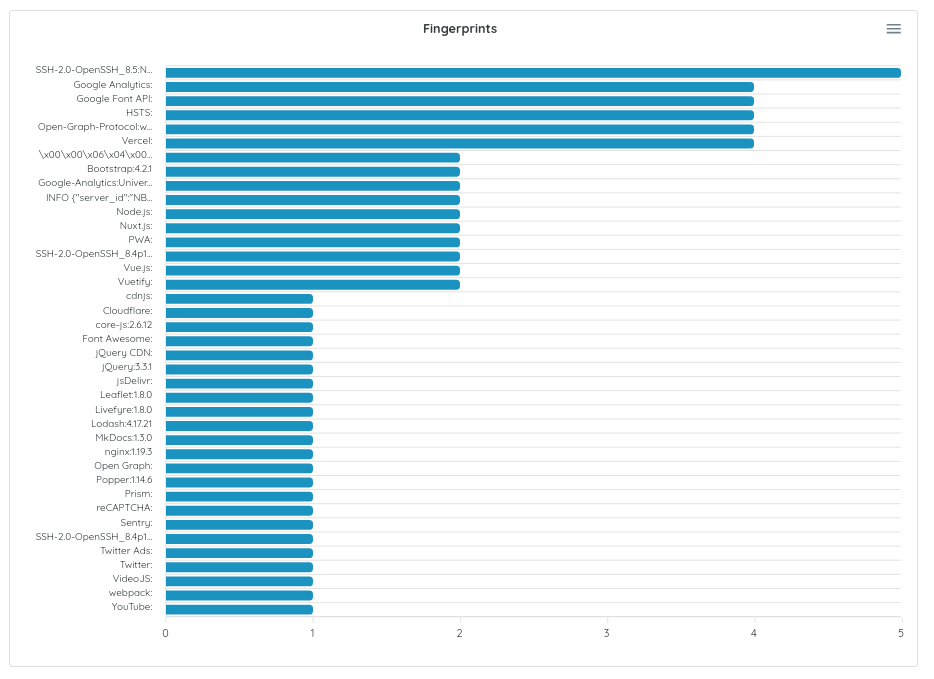
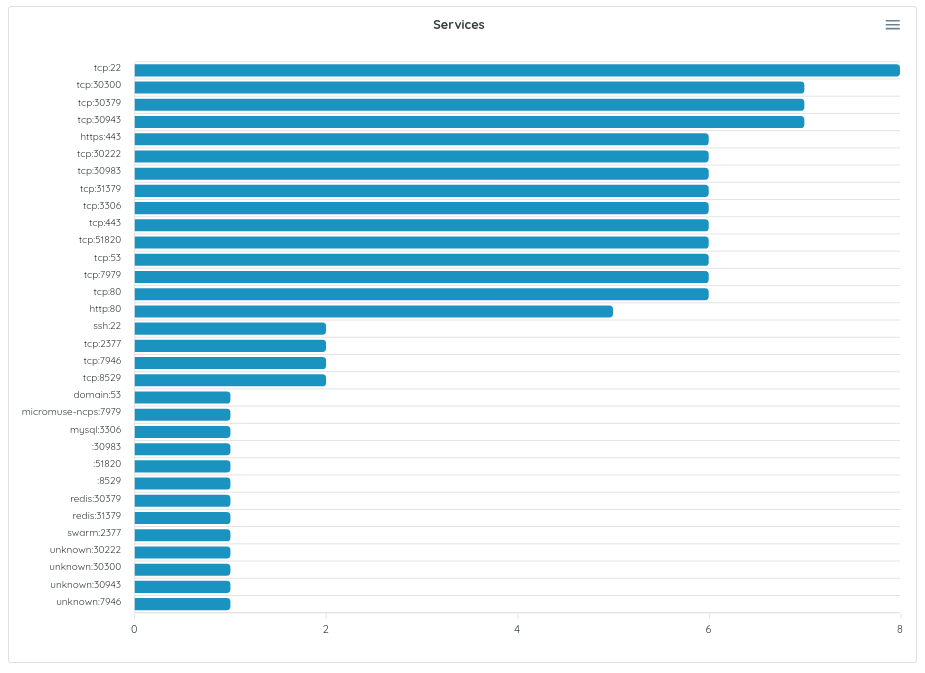
The fingerprint and services metrics give a high-level overview of the most common tech stacks and exposed services. This is great for prioritizing hardening efforts or focusing a manual review on the most impactful stacks and services.
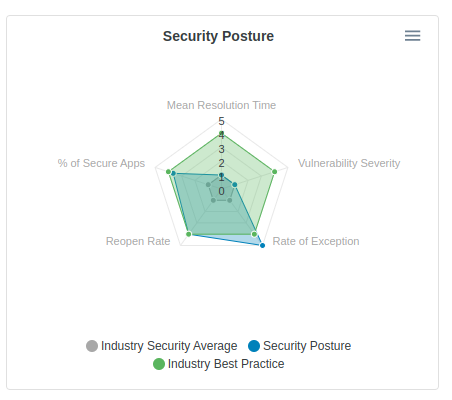
Security Posture
The security posture allows you to understand your organization's strength and resilience compared to other organizations and industry best practices.
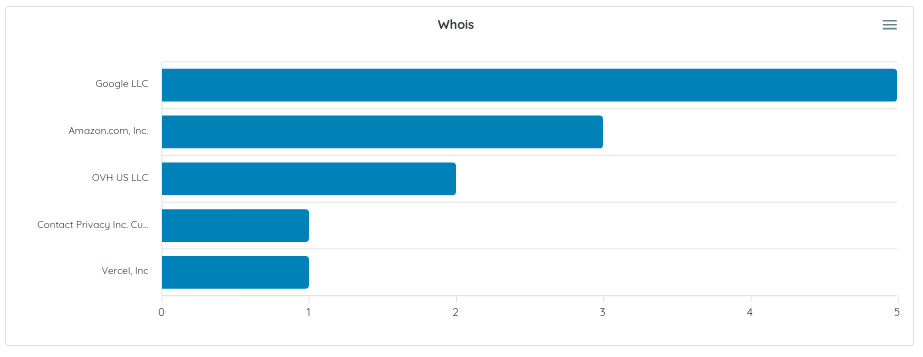
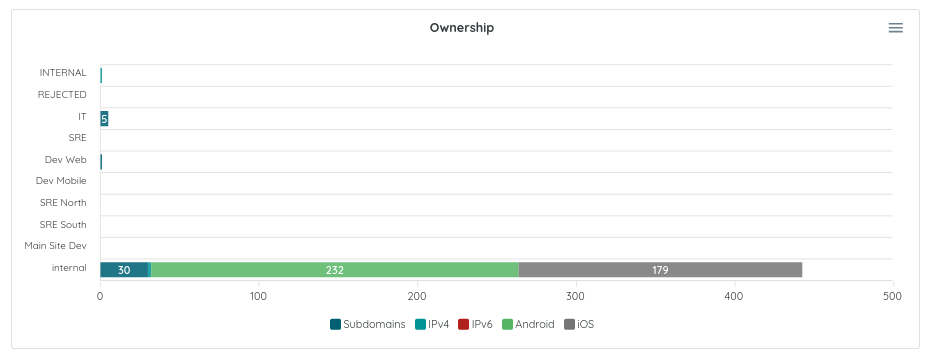
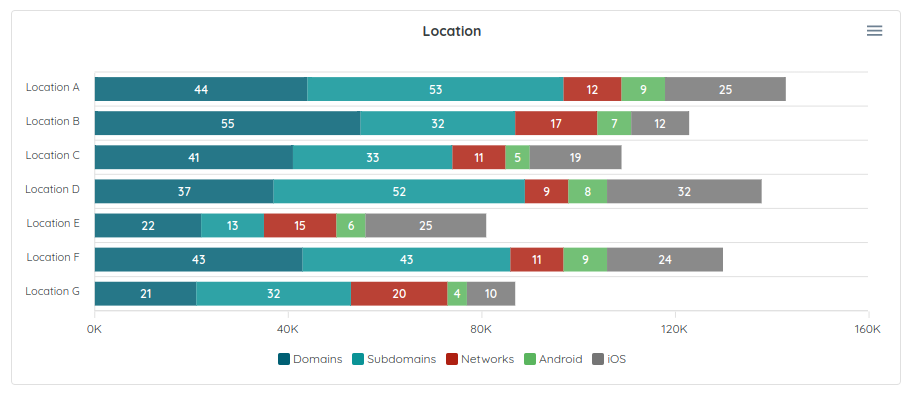
Whois, Ownership, and Location
Where is my asset and, who owns them? These metrics answer these questions showing you the owner (who should fix it), location (logical location),and whois information(cloud provider, web hoster, etc).
IP Gelocation / Worldmap view
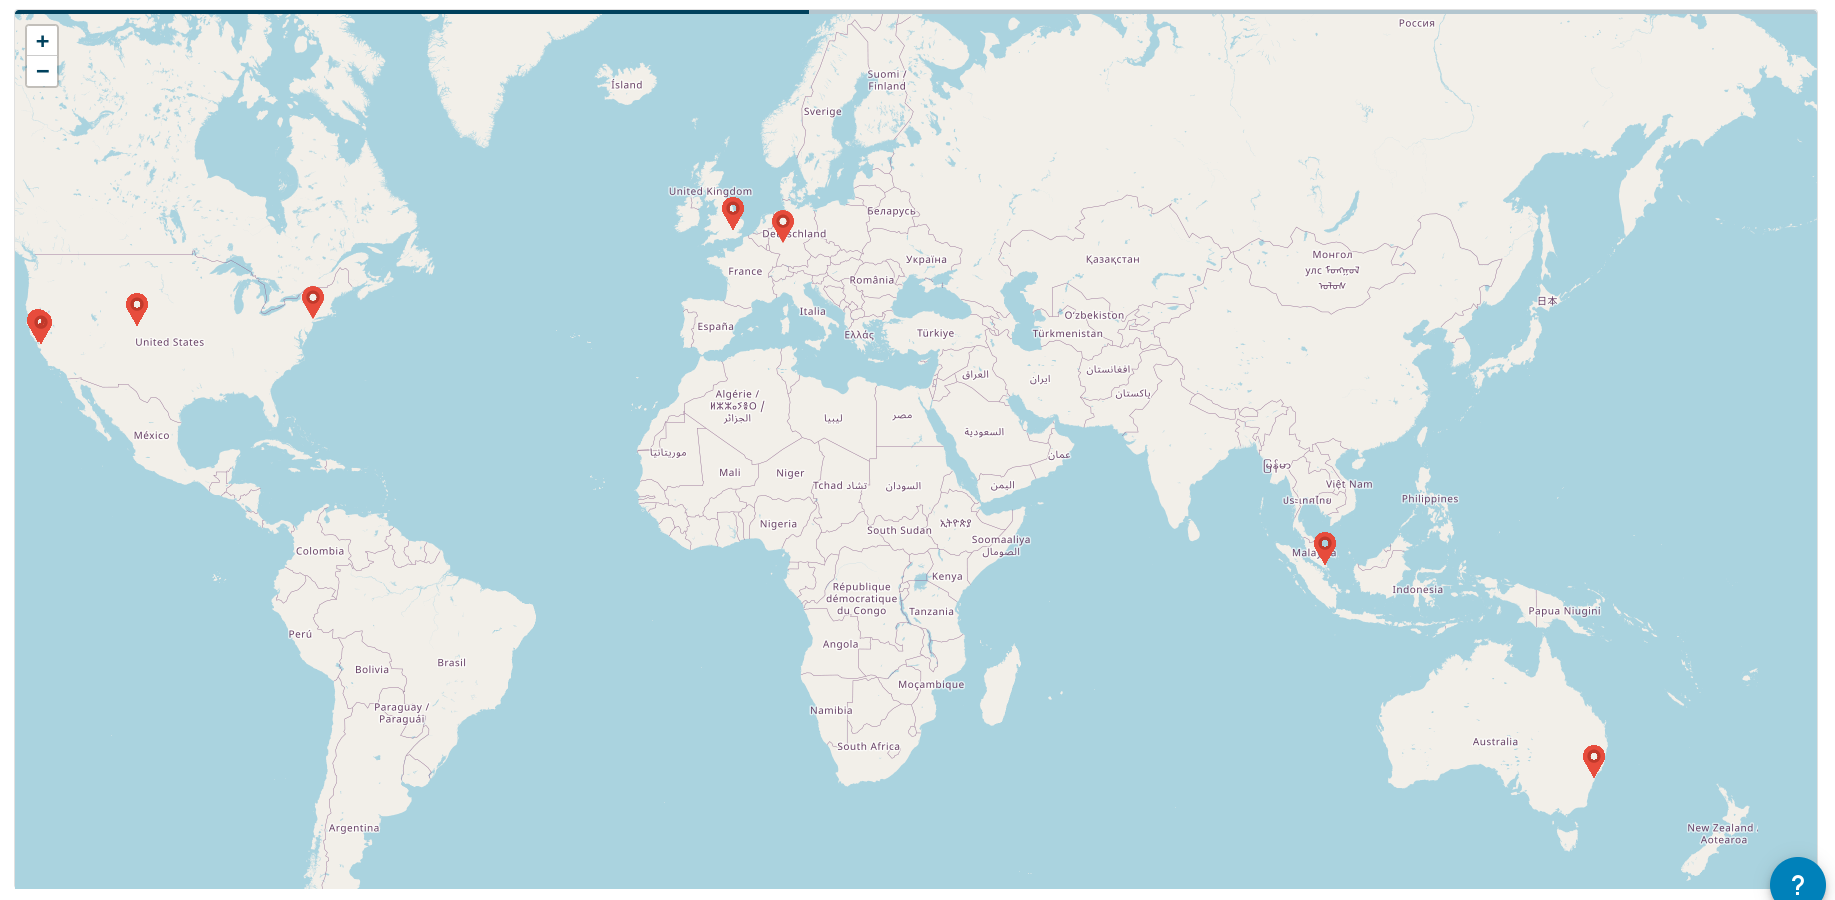
Where my data is going and what is its exact geographical location are critical for several compliance requirements. The world map view helps you see the geographic location of all your assets. You can view the individual asset location from the inventory menu.
Scan, Risk, and Remediation
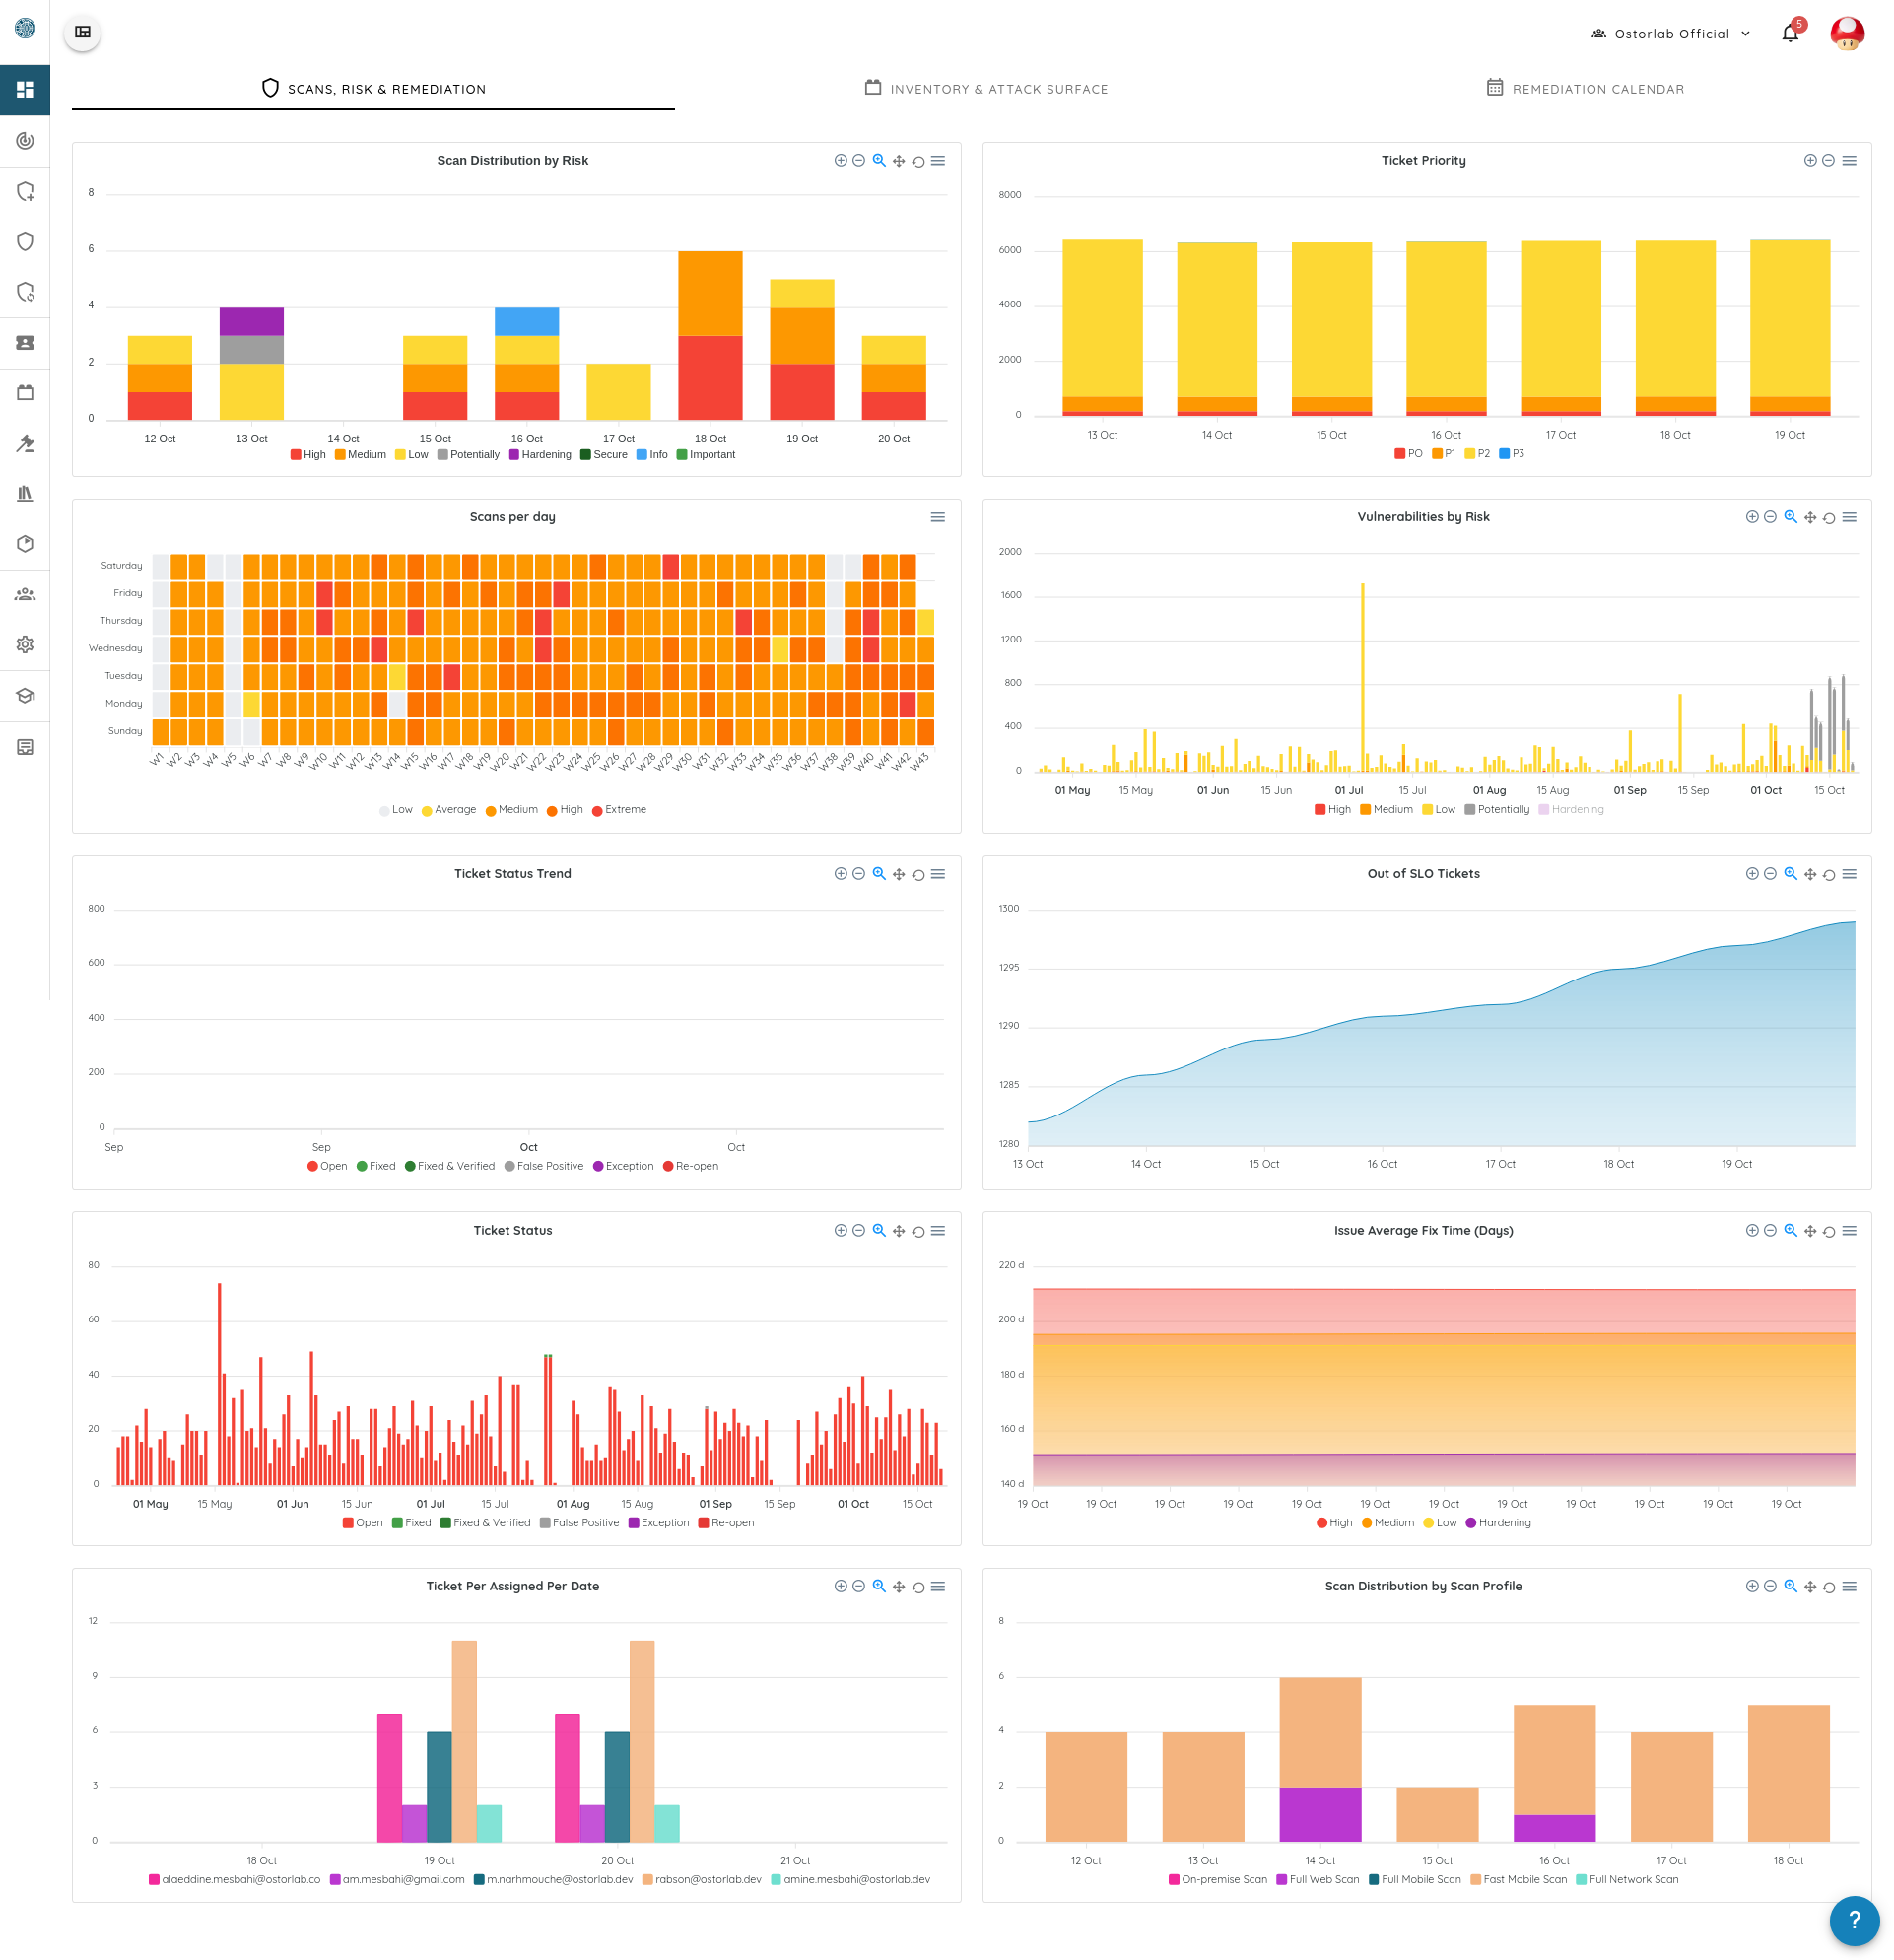
The Scan and remediation section of the dashboard groups all ticket, scan, and vulnerability related metrics.
Ticket Status Trends
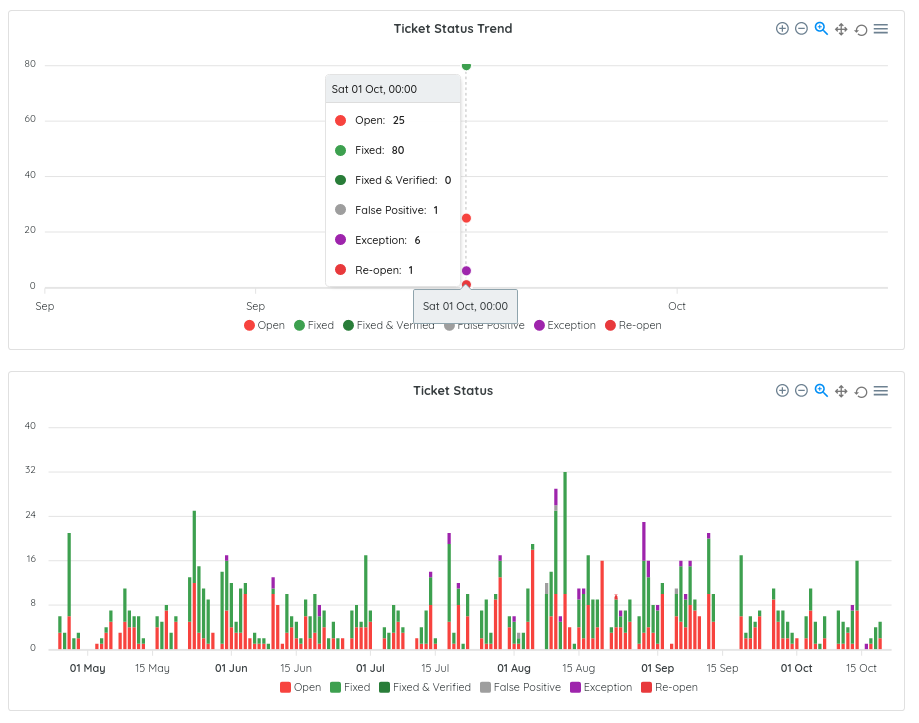
Ticket status trends are monthly and daily metrics showing changes in how many tickets are opened, re-opened, fixed, verified or marked as a false-positive or exceptions. This metric can reflect the velocity of your team at handling and fixing bugs.
Out-of-slo ticket
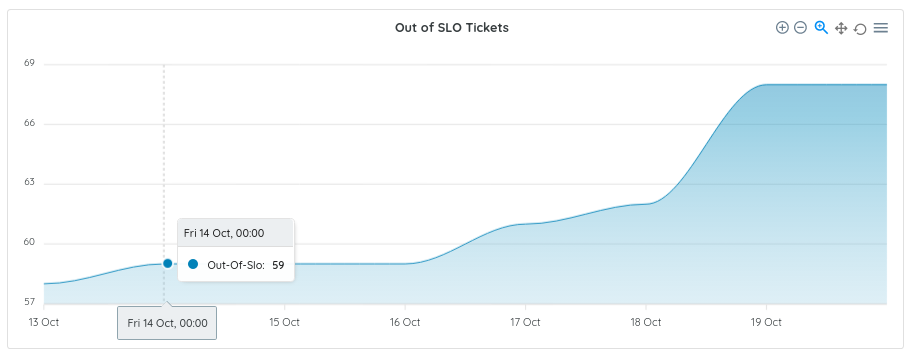
The out-of-slo metric shows how many tickets do not respect your configured patching policy. Ostorlab allows you to define your patching policy by risk rating or ticket priority. This metric either shows an inadequate patching policy or the need for more resources to address the volume and urgency of identified vulnerabilities.
Vulnerabilities By Risk, by Priority
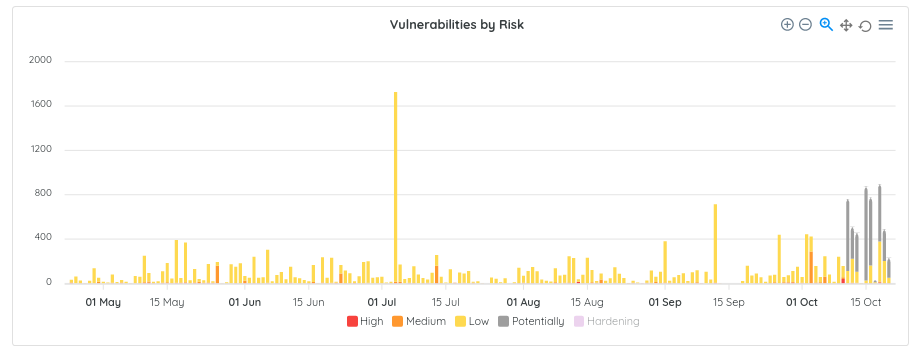
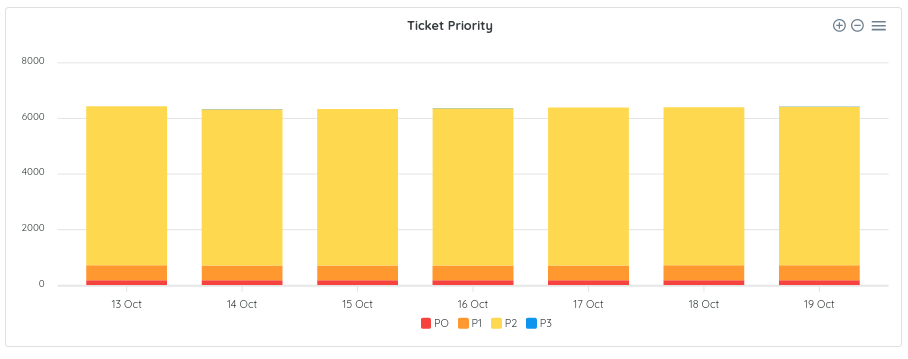
Vulnerabilities and tickets are grouped by risk rating and priority to allow you to see the changes in the number of vulnerabilities and pending tickets on daily basis. So, it answers the question: Are you improving or not?
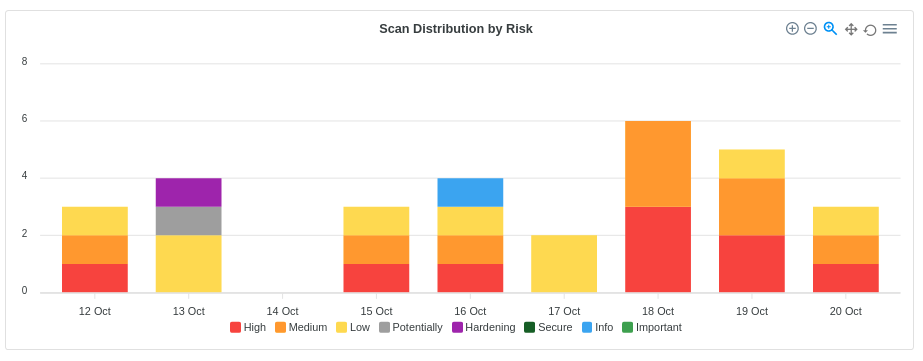
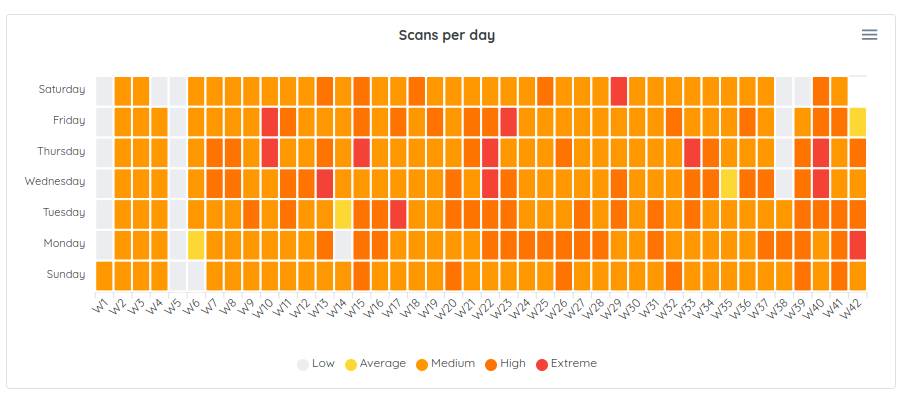
Scan Distribution by Risk and by day
These metrics inform how many scans have high, medium and low issues and how often you run scans. Scan frequency is important if you must adhere to compliance requirements like PCI, Fedramp or HIPAA.
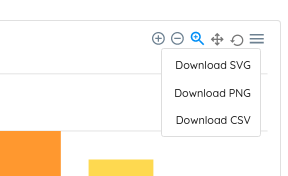
All metrics have a download button to access the data as a PNG, SVG or CSV file and to navigate data:
The dashboard is undergoing continuous improvements to make it more performant, useful, and user-friendly. If there is a metric you would like to see, drop us a message and we will make sure it gets added.
Table of Contents